Highlights
I highly recommend this app for all your stock trading needs
Good desktop app and customer support with Screenulator signup
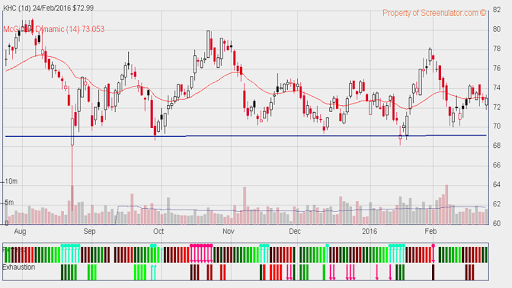
My favorite TA indicators are school cloud and McGinley Dynamic
Very good trading app
Good and friendly customer service with free desktop software
The best stock charting app I have ever used
I also linked to Traders brokerage with realtime
Good development team and customer service
Excellent stock charts and advanced technical analysis indicators
Customer service Very good customer service from Joe
Trial period expired in middle of a trade i lost money due to this
Rendering charts almost useless for intraday trading
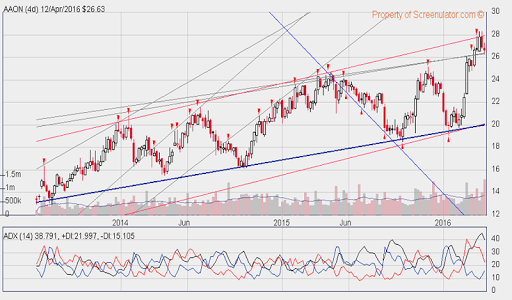
6 as Trend Reversal Indicator turned bullish
It is just a trial app
Ads on top cover info
I made more profit even in the period of poor stock market
Description
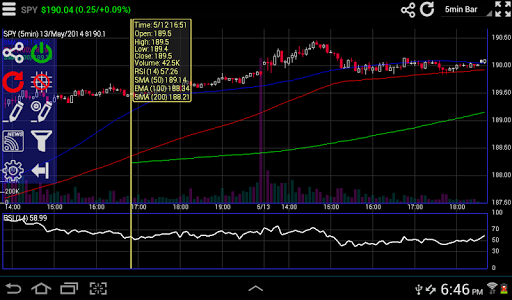
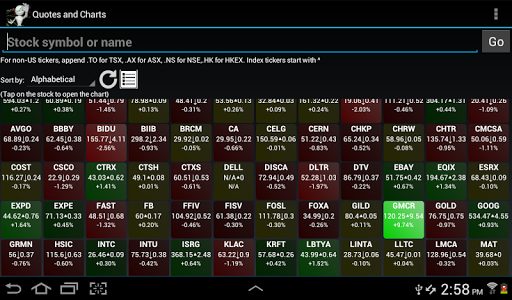
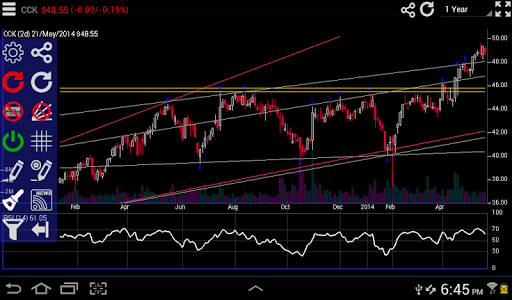
New!! Candlestick Pattern Scanner and Indicator Reliability Lab added to allow Instant backtesting! Interactive Stock Charts is the most intuitive and advanced stock analysis charting app. You can freely adjust time frame and view technical information with touch of finger: scroll, pan and zoom on a beautiful candlestick charts with gesture and touch control. Swipe to scroll into historical analysis, pinch to zoom and change time frame, touch on price points to show detailed quotes and technical indicator values. You can also place real trade orders directly from the charts and portfolio view, through our partner Tradier Brokerage for US equity and options. Backed by Screenulator's patent pending automated chart pattern and trendline recognition engine, and industry's first 9,13 indicator completion screener! Interactive Stock Charts also comes with a powerful technical analysis tool set, Indicator Reliability Lab - in-chart backtesting tool and realtime RSS news feed to give you an edge over the market! Unique and patent pending technical analysis tools include: Automated chart patterns and trendlines detection, Trend Reversal and Exhaustion Indicators, candlestick patterns (coming soon). It also comes with powerful screeners for all the above patterns which scans for more than 19000 stocks worldwide for high potential profitable trades. All Screenulator chart patterns are available on www.screenulator.com website for existing subscribers, see website for more member benefits. Recent Additions: Candlestick Pattern Scanner: http://www.screenulator.com/show_video.php?id=-XCcw46omgs Indicator Reliability Lab: About Trendlines: A trend line is a bounding line for the price movement of a security. A support trend line (or a bottom line) is formed when a securities price decreases and then rebounds at a pivot point that aligns with at least two previous support pivot points. Trendlines are considered by many expert traders to be the single most important tools in technical analysis. However, Support and Resistance breakout and Triangle patterns are just example of patterns formed by trendlines. This app automatically draws and screens for stocks with specific patterns.To learn more: http://www.screenulator.com/cgi-bin/v?pid=ref#trendlines About Trend Reversal Indicator: Screenulator's patent pending Trend Reversal and Exhaustion indicators combines 9,13 counting with trendline analysis to pinpoint trend pivots with color coded visual indicator. It has been shown to have an impressive record of identifying and anticipating turning points across the FX, bond, equity and commodity markets. Furthermore, the indicators provide signals not only on a daily chart but also intraday. It identifies when a trend is becoming, or has become, exhausted. This apps automatically identifies Trend Reversal, Trend Exhaustion, and Perfection criteria. It also calculates stoploss levels. To learn more: http://www.screenulator.com/show_video.php?id=TR_EXAMPLES http://www.screenulator.com/cgi-bin/v?pid=ref#reversal Classic TA indicators and overlays: RSI, MACD, SMA, EMA, Bollinger, Keltner band, Donchian Channel, Parabolic SAR, Ichimoku Cloud, McGinley Dynamic, SuperTrend, stochastic, ADX, Aroon, Chaikin, Ultimate, MFI, OBV, ATR, ADL, CCI indicators. Fibonacci Retracement and text annotation tools. Others will available upon requests. Supported markets: EOD and intraday data: NASDAQ, NYSE, AMEX, TSX, HKEX, Australia, India (NSE) EOD data only: JKSE, Shenzhen, Shanghai, Singapore, UK, Paris, Brussels, Amsterdam, Milan, Athens FOREX: All Forex currency pairs Note: This app is free trial for 2 weeks or 100 usages whichever comes first. Instruction Manual: http://www.screenulator.com/ischarts_faq.html Desktop version: http://www.screenulator.com/ischarts_desktop.html
More