Highlights
Great chart portfolio for
Good customer services
Good customer services provided
Makes finding high growth stocks easy
Fantastic profit thanks to screenulator
Good reference for screening powerful stocks
I upgraded to Master Trader package and have been doing very well
Breakout charts screeners are awesome
Very rewarding experience
Great breakout filter adequate me a lots of mone
Total crap unless you pay subsciption bait and switch says its free
Description
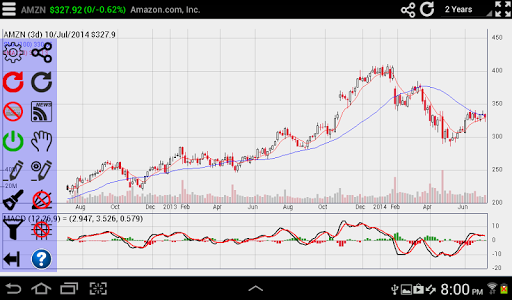
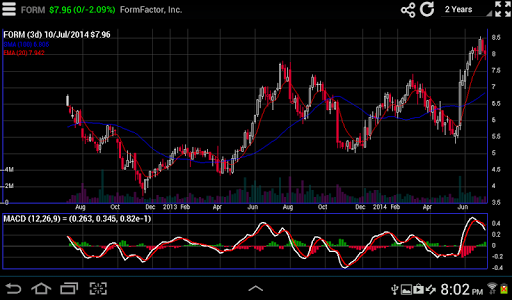
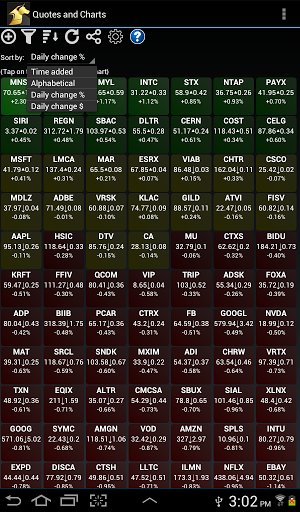
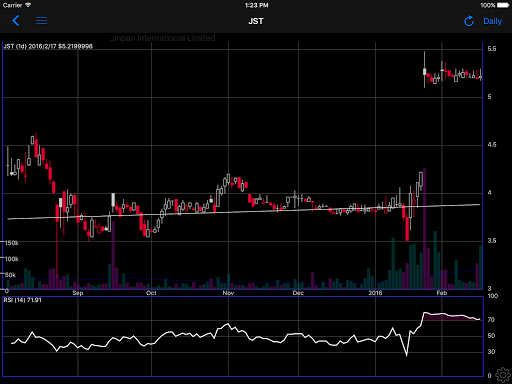
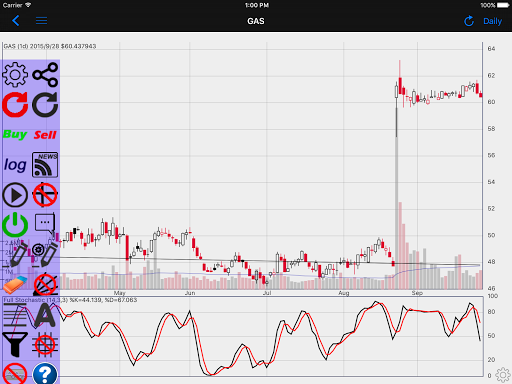
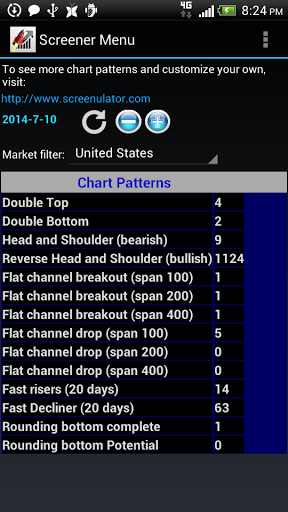
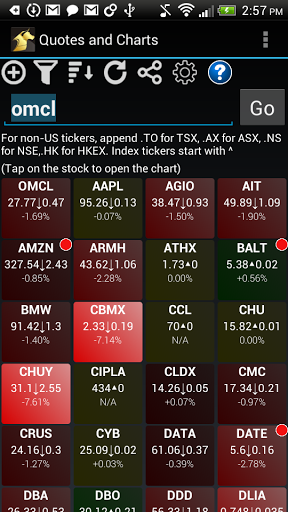
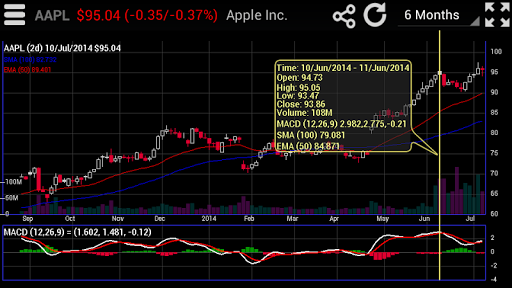
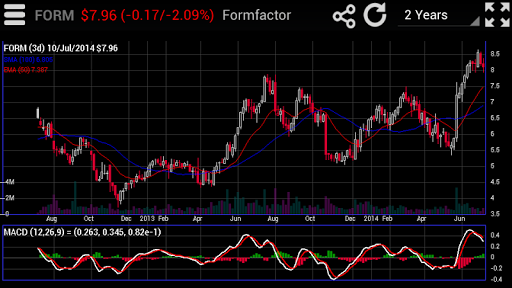
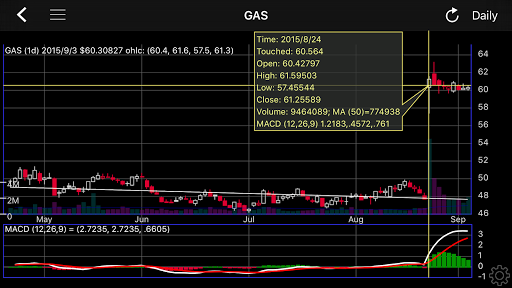
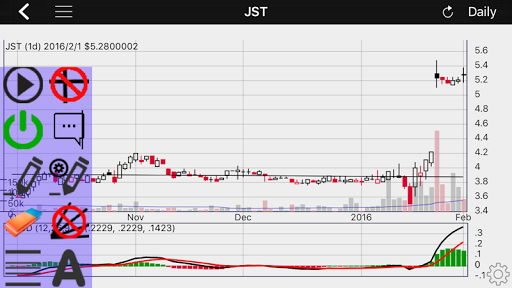
Breakout Charts (v3.xx) by Screenulator.com Breakout Charts screens for high potential breakout chart patterns for over 19,000 stocks world wide! Powered by famous Screenulator Chart pattern recognition engine, two main categories of breakout chart patterns are scanned daily for over 12 worldwide stock exchanges. Flat Channel Breakouts: Flat Channel Breakout pattern is characterized with a long period of narrow trading range followed by sudden increase in price and volume, effectively breaking out of the narrow trading range. This kind of pattern has been described in books such as "How I Made $2 Million in the Stock Market by Nicolas Darvas", and "Stan Weinstein, Stan Weinstein's Secrets For Profiting in Bull and Bear Markets". Channel period of 100, 200 and 400 trading days are screened each day by the app, and breakout is detected when the high volume and high percentage move criteria are met. Usually the longer time frame patterns yields more potential gain, but rare in occurance. Rounding Bottoms: Rouding Bottom is a "U"shaped pattern characterized by a descend from a high point to a flat bottom, followed by a sudden breakout usually accompanied by a news or market events, and resulting a prolonged "rounding up"uptrend, sometimes even far exceeds the previous high. This is usually a long term pattern with the bottom section lasting more than 100 days. In Screenulator, we scan patterns between 100 to 1000 day time span. It is usually a high profitable pattern, but rare in occurance. There are two Rounding Bottom patterns: RB-Potential and RB-Complete. Because of the rarity of this pattern, Screenulator also screens for potential Rounding Bottom (RB-Potential) patterns which have not reached its the previous high (thus incomplete), but only started the initial breakout. The "Rounding Bottom Potential"therefore has more daily qualifiers than "Rounding Bottom Complete", and more profit potentials, albeit with less success rate. Quotes and Charts: The app also contains the industry leading charts from Interactive Stock Charts , with touch info display, scroll, panning, pinch zoom time frame changes. Various TA indicator supports: MACD, RSI, CCI, SMA, EMA, Bollinger, Keltner band, SuperTrend, Aroon, Donchian Channel, Stochastic, Ultimate oscillator, Ichimoku cloud and others will be added upon request. Intraday 1, 5, 10, 30 minute charts. EOD charts range from 6 month to over 10 years of historical data for over 19000 stock symbols. Supported markets (over 15,000 stock symbols): - United States: NASDAQ, NYSE, AMEX, Canada: TSX - Brazil: San Paolo - Asia: HKEX, Australia, New Zealand, India (NSE), JKSE, SGX (Singapore), Shenzhen (China) - Europe: London, Paris, Brussels, Amsterdam, Milan - Forex
More